
Reimagining Jobsite Intelligence
Proof & Scope gives small, independent operators the same data-driven edge as national competitors. We deliver survey-grade maps, thermal diagnostics, and decision-ready reports in 24–72 hours — not weeks — so a local roofing contractor, a small GC, or an independent land developer can compete for the same jobs, close the same claims, and win the same bids as outfits with fleets and in-house survey departments. One standard, every time: if the data has an answer, we find it.
Why Proof & Scope Site Intelligence
Scalable operations that move seamlessly from wide-area monitoring to property-level diagnostics.
Precise radiometric calibration and validated workflows that ensure actionable, repeatable thermal measurements.
Rapid turnaround with customizable reporting to support operations, maintenance, insurance, and regulatory needs.
Deliverables can be tailored to include heat-map overlays, GIS-ready layers, site-level PDF reports, csv inventories of thermal anomalies, and API endpoints for automated ingestion into client systems.
Interactive GeoMapping Suite
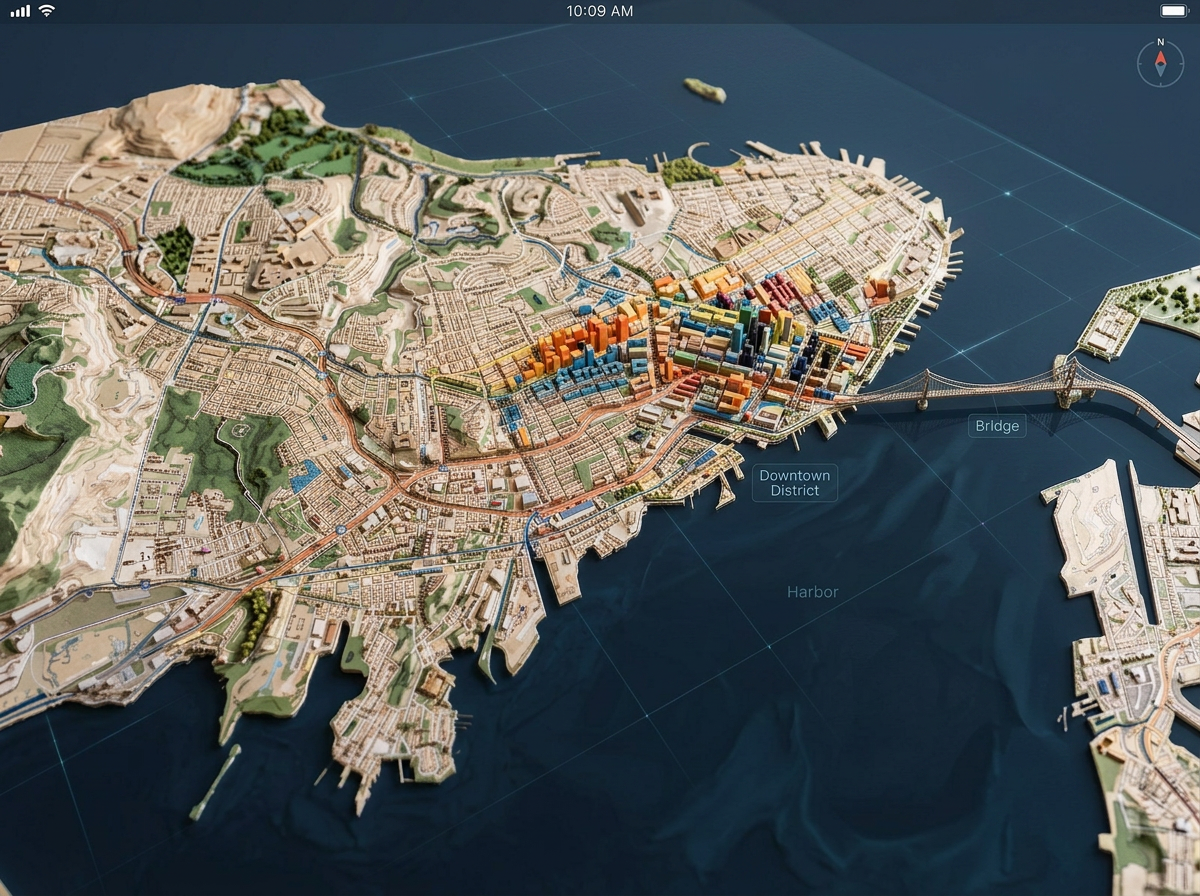
Your flight data, mapped and usable the same day — not stuck in a GIS backlog. Every job comes back as a multi-layered, high-resolution map: property lines, roof planes, drainage, damage points, and progress markers, all geolocated and ready to hand to a crew, an adjuster, or a client. No GIS degree required.
What we deliver:
Multi-layered maps built from your flight data — boundaries, roof planes, damage points, and progress markers in one interactive view.
Delivered in hours: view and share as soon as processing wraps, not weeks later.
Same workflow whether it's one site or fifty — built to scale with your job volume.
Share links with clients, adjusters, or crews, with permissions you control.
Exports straight into the tools your team already uses — no rebuild required.
Who it's for:
Contractors who need a shareable site map fast, not a GIS project.
Insurance adjusters and property owners who need clear visual context for a claim.
Utility and infrastructure teams tracking assets across a service area.
Developers and land planners who need layered site context before they break ground.
Why it matters:
Turns weeks of manual GIS work into a same-day deliverable.
Puts location-accurate context in front of decision-makers, not just data on a drive.
Scales from a single job site to a full portfolio without changing your workflow.
GIS Integration
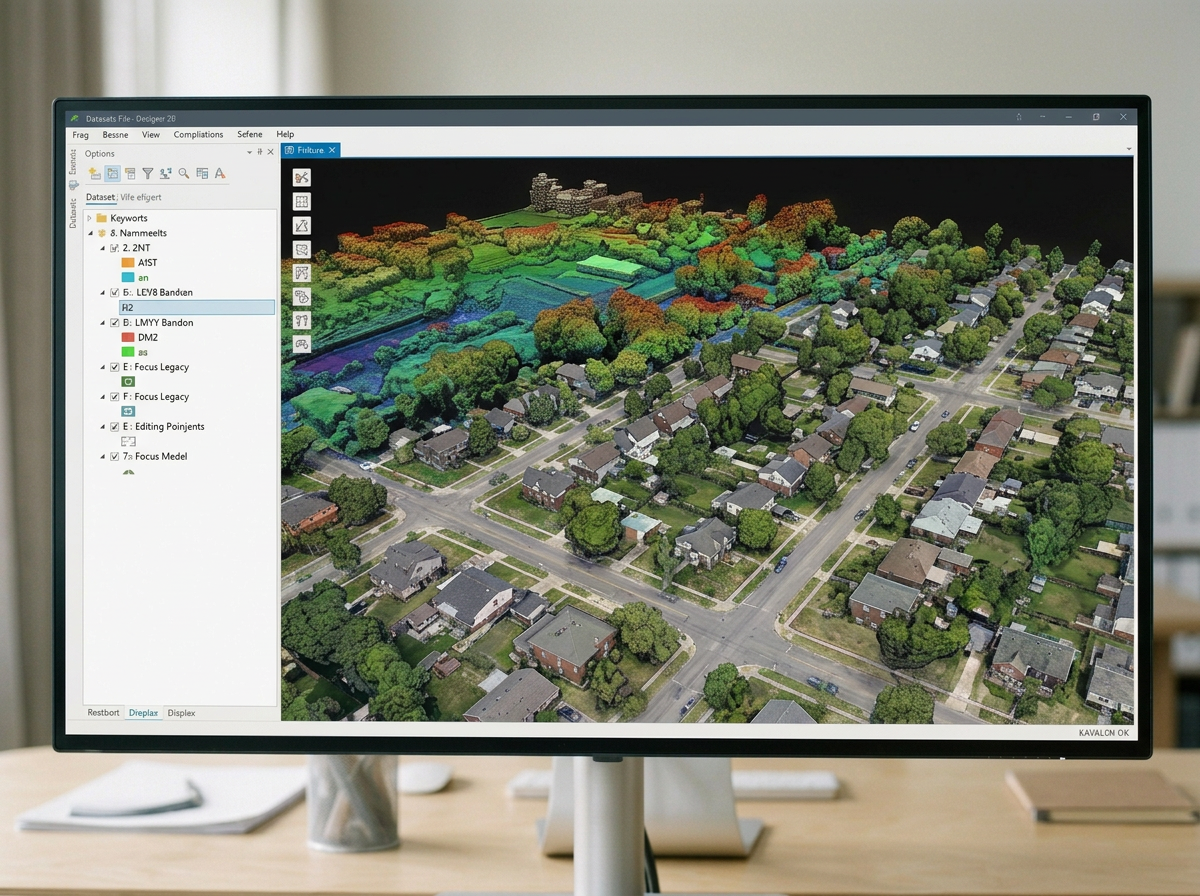
Your survey data belongs in the GIS you already run — not locked in a proprietary viewer. Every flight comes back as clean, standardized layers that drop straight into ArcGIS or QGIS, so your team keeps working in familiar software with data that's usable the moment it lands.
What we deliver:
Native-format exports (Shapefile, GeoJSON, KML, and more) that slot into your existing project layers with no manual rework.
RTK/PPK-corrected positioning on every flight, so new layers align precisely with your existing survey control.
Automated QA — outlier filtering, confidence scoring, and consistency checks — before data ever reaches your desktop.
Secure, encrypted delivery with role-based access for teams managing multiple projects or clients.
One point of contact from flight to final layer — no juggling separate GIS vendors.
Outcome:
Field-ready GIS data that plugs straight into the workflow you already run — accurate, secure, and built to scale from a single site to a full portfolio.
Document your project to sub-centimeter precision and feed it straight into the software that runs your invoicing. We capture every nadir, oblique, and detail shot your project needs, tag and georeference it automatically, and push it into Render, Vitruvi, or your platform of choice — so measurable takeoffs and progress percentages turn into invoice-ready line items without a manual re-entry step.
Redline Completion
What we deliver:
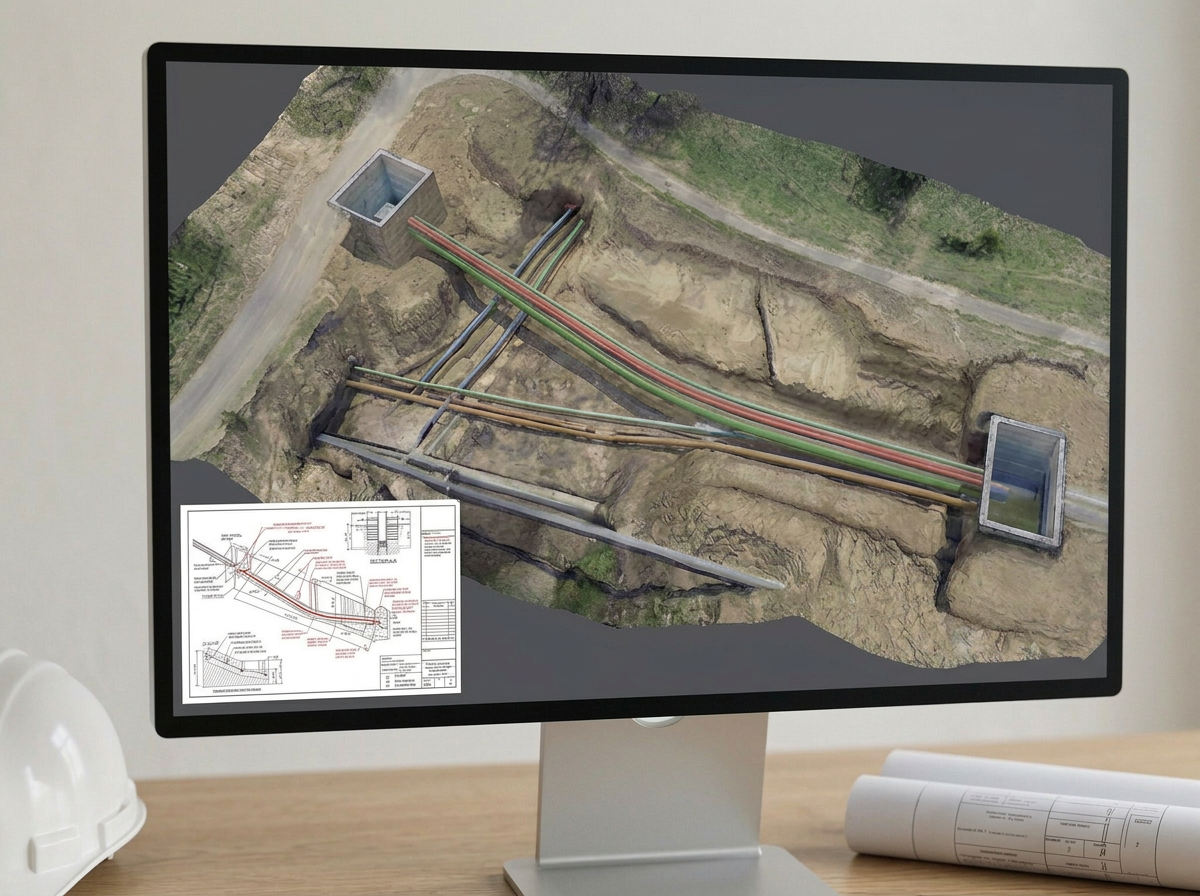
Sub-centimeter accurate documentation of site conditions and progress.
Full capture workflow — nadir, oblique, ground-level, and detail shots — with metadata and quality checks built in.
Direct ingestion into Render, Vitruvi, and other project platforms you already use.
Automated tagging, georeferencing, and alignment to your project coordinate system.
Deliverables built for billing: takeoffs, progress percentages, change orders, and payment triggers.
Push-button invoicing: validated project data exported as invoice-ready line items to your accounting system.
Why it works:
Precise capture reduces rework and dispute risk.
Standardized processing keeps results consistent across projects and platforms.
Automation links field data straight to billing, compressing your cash cycle.
Open integration approach — works with the stack you already have.
Tell us what project software and accounting platform you're on, and we'll come back with a scoped configuration and estimate — no generic proposal, just a plan built around your stack.
Roof, Property and Insurance Inspections
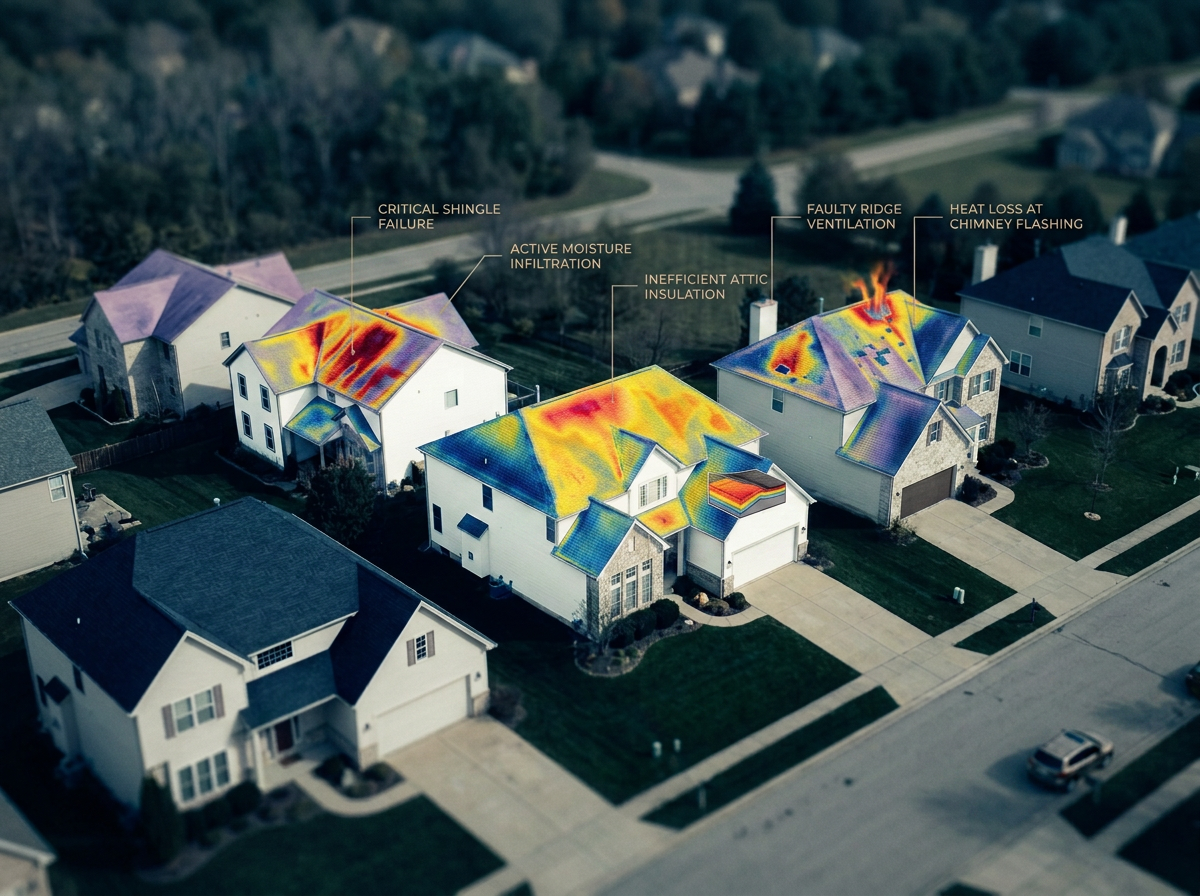
High-level roof scans flag likely issues fast, so your sales team spends time on the highest-conversion prospects. Low-level thermal scans catch subsurface moisture and heat leaks invisible to the eye. LiDAR quantifies roof area, volume, pitch, and slope for a precise, data-backed assessment — the result is stronger claims with insurers: higher payouts, less pushback.
We run airborne and ground-based thermal imaging to cover everything from a single rooftop to a full corridor — flagging temperature anomalies, energy loss, equipment hotspots, moisture intrusion, and vegetation stress, each tied to precise GPS location.
Wide-area thermal surveys
Large-scale thermal mapping covering hundreds to thousands of acres per flight.
Routine sweeps for utility corridors, solar farms, powerlines, and pipelines to catch emerging risk early.
Radiometrically corrected thermal mosaics for reliable trend analysis across seasons.
Property-level thermal inspections:
Close-range surveys of buildings, industrial sites, and rooftop assets pinpointing envelope heat loss, HVAC inefficiency, and roof moisture.
Layered deliverables combining thermal, visible-light, and GPS-tagged data points for clear diagnostics.
Technician-verified findings for remediation guidance and compliance documentation.
Use cases:
Utilities: catch failing components before an outage.
Solar operators: identify underperforming panels and array-level defects.
Property managers: prioritize retrofit spend by pinpointing exact losses.
Insurance and claims: rapid, defensible damage assessment after storms or fire.
Environmental and ag monitoring: spot moisture stress and irrigation leaks early.
Infrastructure Inspection
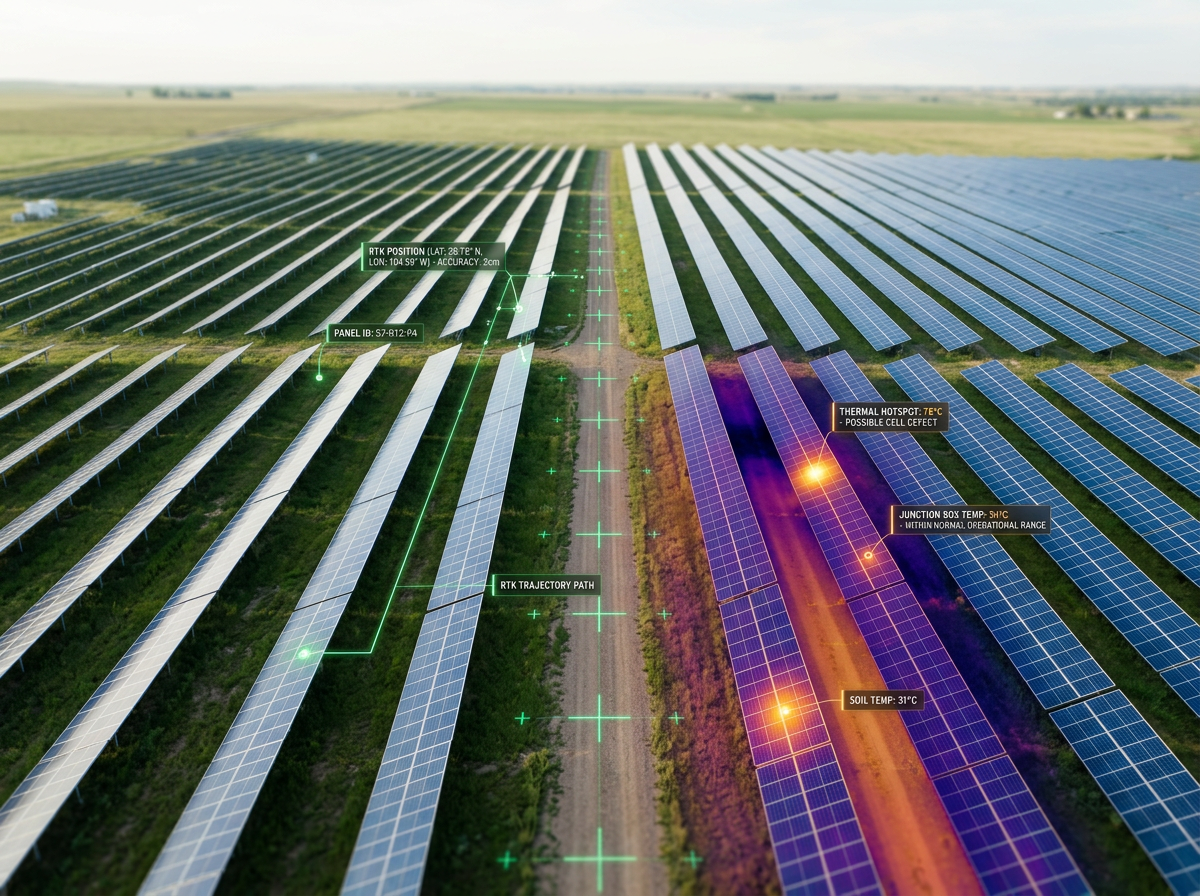
Thermal imaging reveals what a visual inspection can't: hot spots, cell and module defects, connection failures, and soiling patterns across solar farms and infrastructure assets. Drone-mounted sensors cover large arrays and dispersed assets fast, producing georeferenced heat maps for trend analysis, predictive maintenance, and post-event forensics.
Thermal + LiDAR + RTK, working together
LiDAR adds precise geometry to thermal data — elevation models, panel tilt, row spacing, and structural deformation — so anomalies map to exact components and asset IDs, not just a general area. RTK adds centimeter-accurate georeferencing on top, so repeat inspections align perfectly and thermal, LiDAR, and GIS/SCADA data all line up. Together, that's a unified, auditable dataset for root-cause analysis, compliance, and insurance claims.
Beyond solar
The same multi-sensor approach applies across substations, transmission corridors, rail assets, bridges, and buildings — thermal catches electrical and mechanical faults, LiDAR captures structural geometry and clearance, RTK pins the exact location for the maintenance crew that follows.
The payoff
Faster, more accurate fault detection. Lower operating costs through targeted repairs instead of blanket maintenance. Fewer manual close-up inspections. Better vegetation and structural management. For developers, EPCs, operators, and asset managers, it's a shift from reactive to predictive — more uptime, lower lifecycle cost, less risk on large infrastructure investments.
Legacy Record Digitization
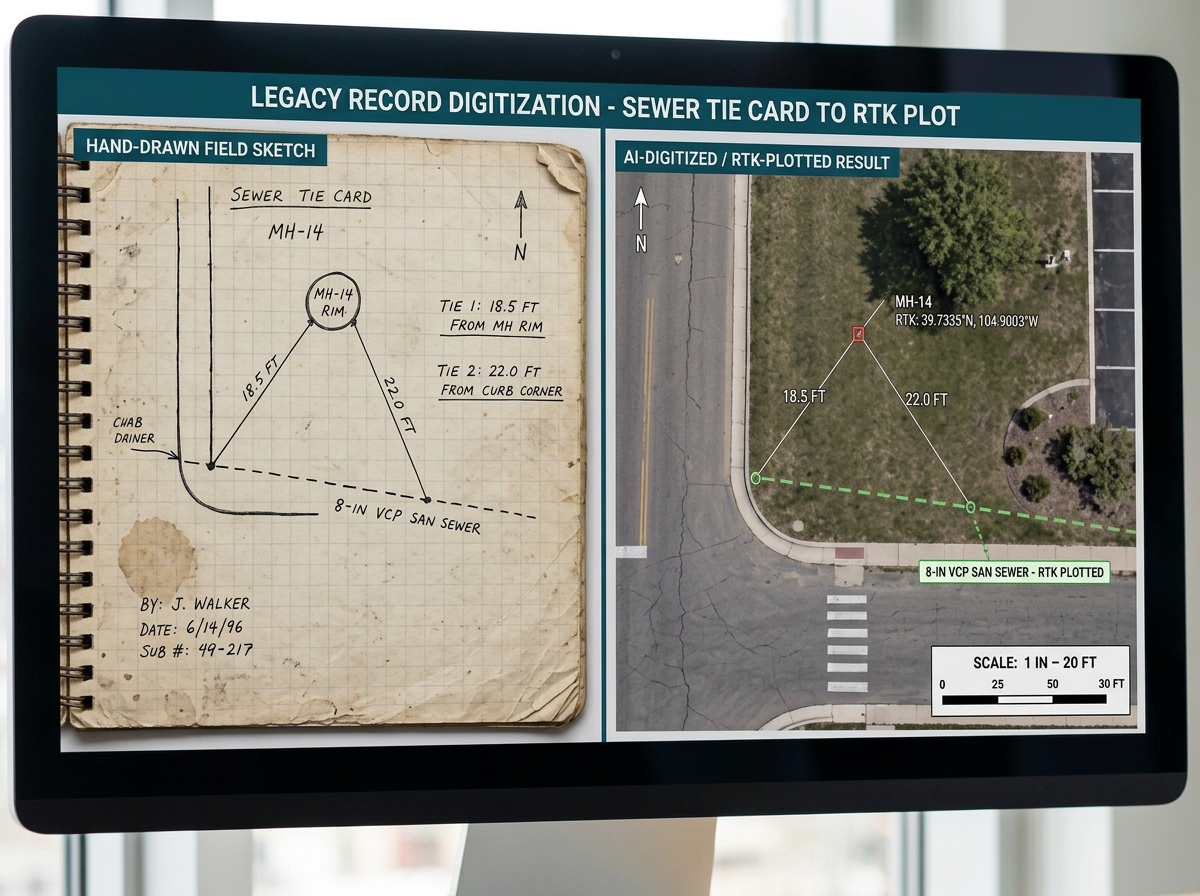
Turn old hand-drawn maps into accurate, GIS-ready digital records — tied to known survey points, not guesswork. We use computer vision to detect boundaries, annotations, and scale cues on scanned drawings, match them to real control points, correct for scan distortion, and hand back clean vector layers.
What we do:
Detect lines, parcel boundaries, annotations, and scale cues from scanned drawings using computer vision and georeferencing models.
Match detected features to known survey markers, benchmarks, or coordinate labels.
Auto-correct scan distortion and warping, then convert to GIS-ready vector layers with attribute data.
Confidence-score every feature, with an interactive QA pass for manual review.
Export to GeoJSON, Shapefile, DXF, KML, or your required coordinate system.
Key benefits:
Faster and cheaper than full manual redrafting.
Anchored to modern survey control for real accuracy, not approximation.
Full audit trail: source image, transformation steps, matched control points, provenance.
Coming Soon: Ground Penetrating Radar
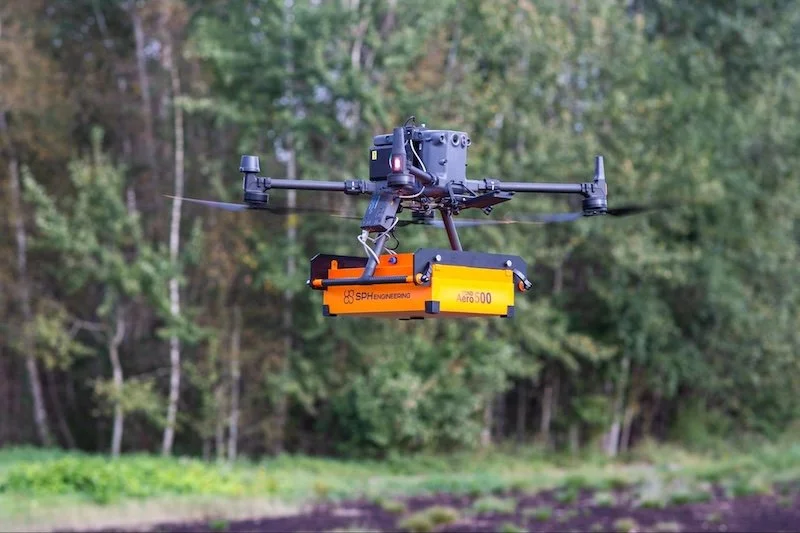
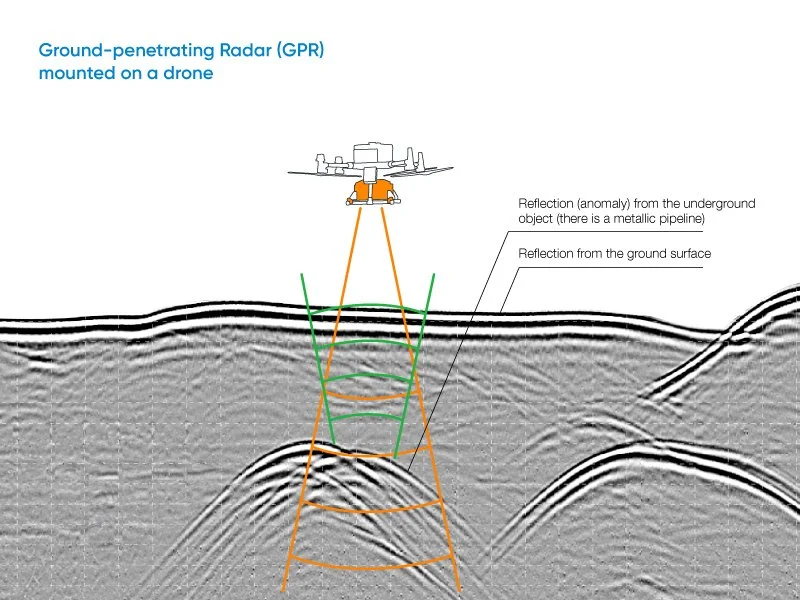
Before a shovel goes in the ground, we put a radar over it. Aerial GPR maps buried utilities, abandoned lines, and voids along your proposed bore path — non-metallic conduit and old clay/PVC included, not just what a locate ticket catches. It's a faster, safer pre-excavation pass than a ground crew walking the alignment, and it gives your crew a real subsurface picture instead of a hope.
What we deliver:
Detect metallic and non-metallic utilities — pipe, conduit, and cable that a locate wand or magnetometer alone will miss.
Cover large or hard-to-access alignments (steep grades, wetlands, unstable fill) that a cart-based crew can't safely walk.
RTK-tied positioning ties every anomaly to a precise coordinate, not a rough field sketch.
Delivered as a GIS-ready anomaly map you can overlay directly on your bore plan or site drawing.
Who it's for:
HDD contractors and drilling crews who need pre-bore utility clearance beyond a standard 811 locate.
Municipalities and campuses planning excavation, trenching, or reconstruction.
Site developers and GCs who need void/sinkhole screening ahead of grading or foundation work.
Utility owners tracking abandoned or undocumented lines in a service area.
Why it matters:
Roughly 60% of utility lines are private and don't come with a public 811 locate aerial GPR catches what a locate ticket can miss.
Non-invasive: no excavation, no lane closures, no crew walking hazardous or unstable ground.
Turns a guess about what's underground into a georeferenced picture your HDD crew can plan around.
Honest caveat:
Airborne GPR trades some penetration depth and resolution for speed and safety versus ground-coupled surveys — typically effective to a few meters in favorable soil, less in wet clay or dense fill. We scope antenna frequency and flight parameters to your site conditions and tell you upfront what depth and resolution to expect.
Antenna Frequency
1000 MHz
500-600 MHz
50–300 MHz (LF)
Typical penetration
1’–1.6’
~3.3’–6.5’
~13’–98’ +
Approx. smallest target
1.25”–3.9”
3.9”–7.8”
11”–39”
Recommended altitude
≤ 3.2’
≤ 3.2’–5’
≤ 6.5’
Notes
Highest resolution; most affected by soil moisture; keep AGL low and stable
Balanced depth vs. resolution; good “first-pass” frequency for open-terrain jobs
Deepest penetration at the cost of resolution
Ready to Chart What’s Next?
Send us your vision, and our experts will engineer a custom geo solution that propels you into the future—let’s connect today.